Analysis
Before Analysis
Before we jump into analysis, it is wise to have a look on the key terms often used in analyzing the data.
The users must build a sound understanding of statistical concepts such as hypothesis formulation and testing, distribution, and some widely known parameters(mean, median, mode , standard deviation, standard error).
Doing analysis
This tutorial will follow an analytical approach based on the data measurement types. Lets begin with analyzing the nominal/categorical data. The descriptive statistics is the best suitable option for such categories of data. Frequency and test of independence are most widely used analysis for nominal variables.
Descriptives for Nominal/categorical data
To perform this analysis, we can go Analyze->Descriptive statistics->Crosstab. The sample output image below shows independence test between gender and attending a meeting.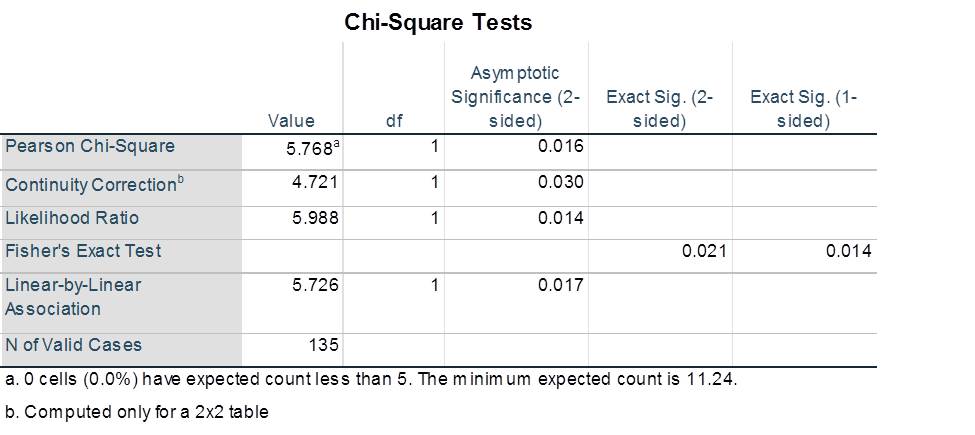
Correlation
If the variables are ordinal, coorelation scores can be used by selecting Crosstab->statistics->correlation. We should report Spearman’s correlation score from the table for the ordinal variables as they are calculated using rank order. If the variable is scale, use Pearson’s correlation score and related significance level from the output table.
Other Statistical Options
The above scores are the widely used and primary reported values to test hypothesis. Based on the variable type (nominal/ordinal/scale) and your own understanding of statistical terms, other scores can be reported from the options given in the statistics tab.